With robust, comprehensive analysis, Observer Analyzer delivers immediate problem resolution and drives long-term performance improvements. It provides the complete package that network administrators, architects, and engineers need to achieve maximum performance:
How do network teams benefit from Observer Analyzer?
They manage the impact of new application rollouts on the network; validate the performance of telepresence initiatives; distinguish network issues from application failures; and apply baseline intelligence for the proactive management of critical applications.
Analyzer is essential for:
From AppleTalk to VoIP, Analyzer offers detailed views of individual packets and decodes more than 740 leading protocols and countless sub-protocols.
Application Performance Reduce downtime and increase productivity with deep, contextual application analysis. Get response-time data for thousands of applications, along with performance metrics, transaction detail, and predictive analytics that show the network impact of new application rollouts.
Expert Analysis Access immediate intelligence in both real time and post-capture analysis using Expert Events for TCP, UDP, VoIP, wireless networks, and more. Track and organize common services, flag response performance by severity, monitor slow-responding port-based protocols, and distinguish network from application issues by separating local traffic from WAN/Internet traffic. Enhanced HTTP application monitoring provides deep insight into how web-based applications operate and how users access IT resources, including browser type and operating system.
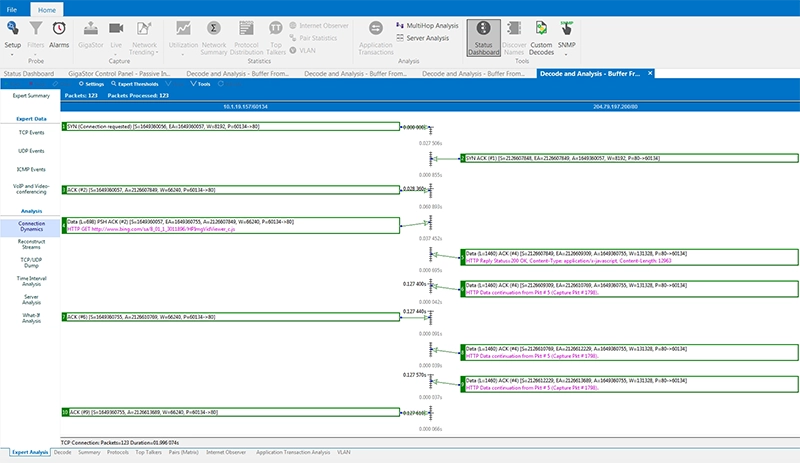
Conversation Analytics The only network analyzer that offers Connection Dynamics: it graphically breaks down each network conversation step by step, identifying which request or response is causing the problem. Retransmissions and lost packets are flagged for instant recognition of the source of the problem. Gaps between sections of the conversation identify latency and response-time issues. TCP/UDP Expert Events show excessive retransmissions and provide an explanation of the problem along with possible causes.
Trending Use network trend analysis to forecast IT needs or justify upgrades through comparative reports. View and analyze network traffic statistics over time — from days to years. Trending metrics can be broadly applied to diverse challenges, such as translating web traffic into Internet usage data to correctly bill departments based on service consumption.
Troubleshooting Perform in-depth troubleshooting with an interface that offers intuitive workflows for fast resolution. Detailed analysis capabilities with root cause identification allow issues to be pinpointed at their source with precision and ease. High-performance packet capture, decoding, and filtering provide additional support.
Triggers and Alarms Analyzer implements constant monitoring of activity levels and immediately sends prioritized alerts when network fluctuations exceed configured thresholds. Alert options include: email, messaging, support tickets, or automatic initiation of a packet capture. Other functions include flagging activities or errors from a predefined list; configuring custom notifications based on any filter; receiving emails with virus information (including source and destination); and placing triggers on any WLAN activity.
Packet Capture Analyzer's packet capture, decoding, and filtering capabilities are unmatched. It allows individual packets to be viewed and decodes more than 740 leading protocols and countless sub-protocols. Observer filters packets quickly and efficiently by address, address range, protocol offsets, and protocol presets, either through the intuitive graphical interface or via the command line.
Optimized User Interface The latest version of Analyzer has a completely redesigned interface to improve the user experience and speed up troubleshooting workflows, making rapid root cause determination easier.
HTTP Application Monitoring Enhanced HTTP application monitoring provides detailed insight into how web-based applications operate and how users access IT resources, including browser and operating system information.
Microsoft UC Support Get in-depth support for the Microsoft UC platform. Access summary views of UC/VoIP metrics and rate the user experience on every call. Along with VoIP tracking, teams can monitor Microsoft Lync server health by combining Analyzer with Observer Infrastructure.
Third-Party Analysis Multiple tools are no longer needed to manage and investigate performance issues, since Analyzer now includes built-in support for third-party analysis and capture export for external analysis and security solutions. This means you can send captures to security devices, compliance and forensic tools, and other network analyzers.
Highlights
- Total visibility into the health of the network and applications
- Views ranging from a high level down to a granular level
- Detailed HTTP tracking for client browser and operating system type
- Custom Key Performance Indicators (KPIs)
- In-depth diagnostics with root cause analysis
- Application performance analysis
- Expert Analysis that alerts on potential issues and resolution strategies
- More than 30 real-time statistics, including bandwidth usage, LAN usage patterns, and more
- Application performance
- Service assurance
- Network performance
- Unified Communications (UC) deployment
- Complex virtual machine (VM) environments
- Cloud computing