The network and its supporting infrastructure have a lot to tell you… if only you knew how to ask: What's connected? Who is communicating? What are they saying? The growing number and diversity of devices and applications in today's hybrid IT environment are becoming increasingly difficult to manage — whether related to IoT, SD-WAN, cloud migrations, or remote users at the network edge — making it more urgent than ever to answer these questions.
Observer GigaFlow comes to the rescue by integrating network, infrastructure, and user data into a single enriched flow record, captured and retained over time. The intelligent combination of large volumes of unstructured data into a concise record provides deep detail on network device types, connectivity, traffic control, and usage patterns, all in an easy-to-understand visual. This information is maintained at the individual user/host level, over time, and across all communications that traverse the environment from any point of view, which is especially valuable for NetOps and SecOps teams when investigating anomalous activity
GigaFlow's enriched flow data now coexists in Observer Apex alongside packets and metadata from GigaStor/GigaStor M. Optimized workflows, network analysis, capacity planning intelligence, and cybersecurity investigations from a single starting point. It has never been easier for all IT stakeholders and business leaders to have comprehensive network visibility.
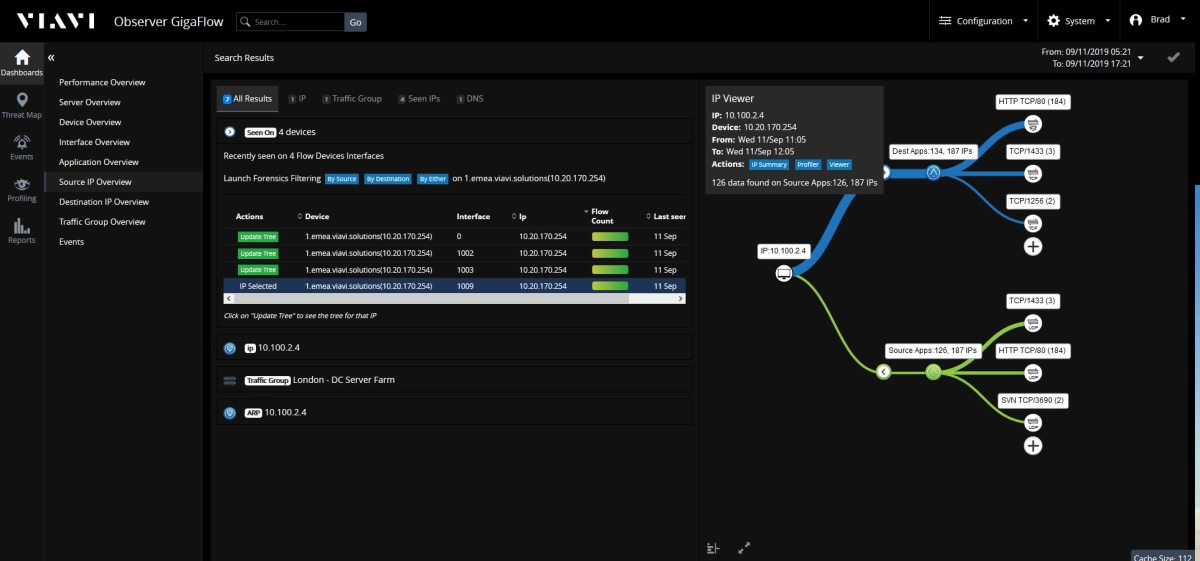
Intuitive visualizations with IP Viewer By compiling information from Layer 2 through Layer 3 into a single enriched flow record, Observer can generate unique interactive visualizations that illustrate the relationships between user, IP, MAC, and application usage on the network. A NetOps or SecOps user can simply enter a username and immediately find all associated devices, interfaces, and applications. Discovering what's connected and who is communicating on your network has never been easier.
Enriched forensic analysis GigaFlow offers real-time and long-term historical insights into the status of end users and devices, as a function of the underlying service health on each network traffic interface. GigaFlow's enriched flow records dynamically capture all relevant data, including timestamp and location, continuously over extended periods. Thanks to this, IT teams can navigate to a specific event or anomaly in the past to diagnose and resolve the issue by answering the questions: who was impacted?, when?, where?, and how did the incident occur?
Network capacity planning reports With intuitive capacity planning reports, GigaFlow enables IT teams to perform proactive assessments of WAN spending, as well as reactive resolution of capacity-related issues. A simple, color-coded dashboard highlights the interfaces most heavily utilized over the longest time. If a congested site keeps growing, the report will show more areas in red, suggesting those sites may need an upgrade. Application summary charts help identify which application is responsible for the growth. In addition, you can drill down to the forensic level directly from the capacity planning reports.
Device- and site-based workflows GigaFlow provides insight into usage and utilization by interface down to the Layer 2 switch level, with graphical summaries of the most active sites or devices and the ability to drill down into individual WAN links. This is ideal for general assessments of end-user experience at any point along the communication path, and is valuable for quantifying the cost/benefit efficiency of assets, for example when deciding where to make new upgrades.
Highlights
- End-user experience and infrastructure visibility provides situational awareness that drives better business decisions to optimize service delivery.
- High-fidelity forensic visibility into network conversations stored over time supports cybersecurity breach investigations, reducing mean time to resolution.
- Advanced service path visibility ensures immediate isolation of the problem domain in hybrid IT environments.
- Cloud and virtual device visibility provides real-time understanding of performance in virtual, cloud, and remote environments.
- An interactive IP viewer that visualizes the relationships between user, IP, MAC, and application usage on the network.
- Intuitive capacity planning reports that help with proactive assessments of WAN utilization.
- New workflows that detail utilization at any site or device interface, with easy drill-down to forensic-level data.